Dashboards & Reporting
See what happened overnight in one view
Live operational dashboards and automated reports that replace emailed job sheets and Monday-morning spreadsheets, built from the systems your work already runs on.

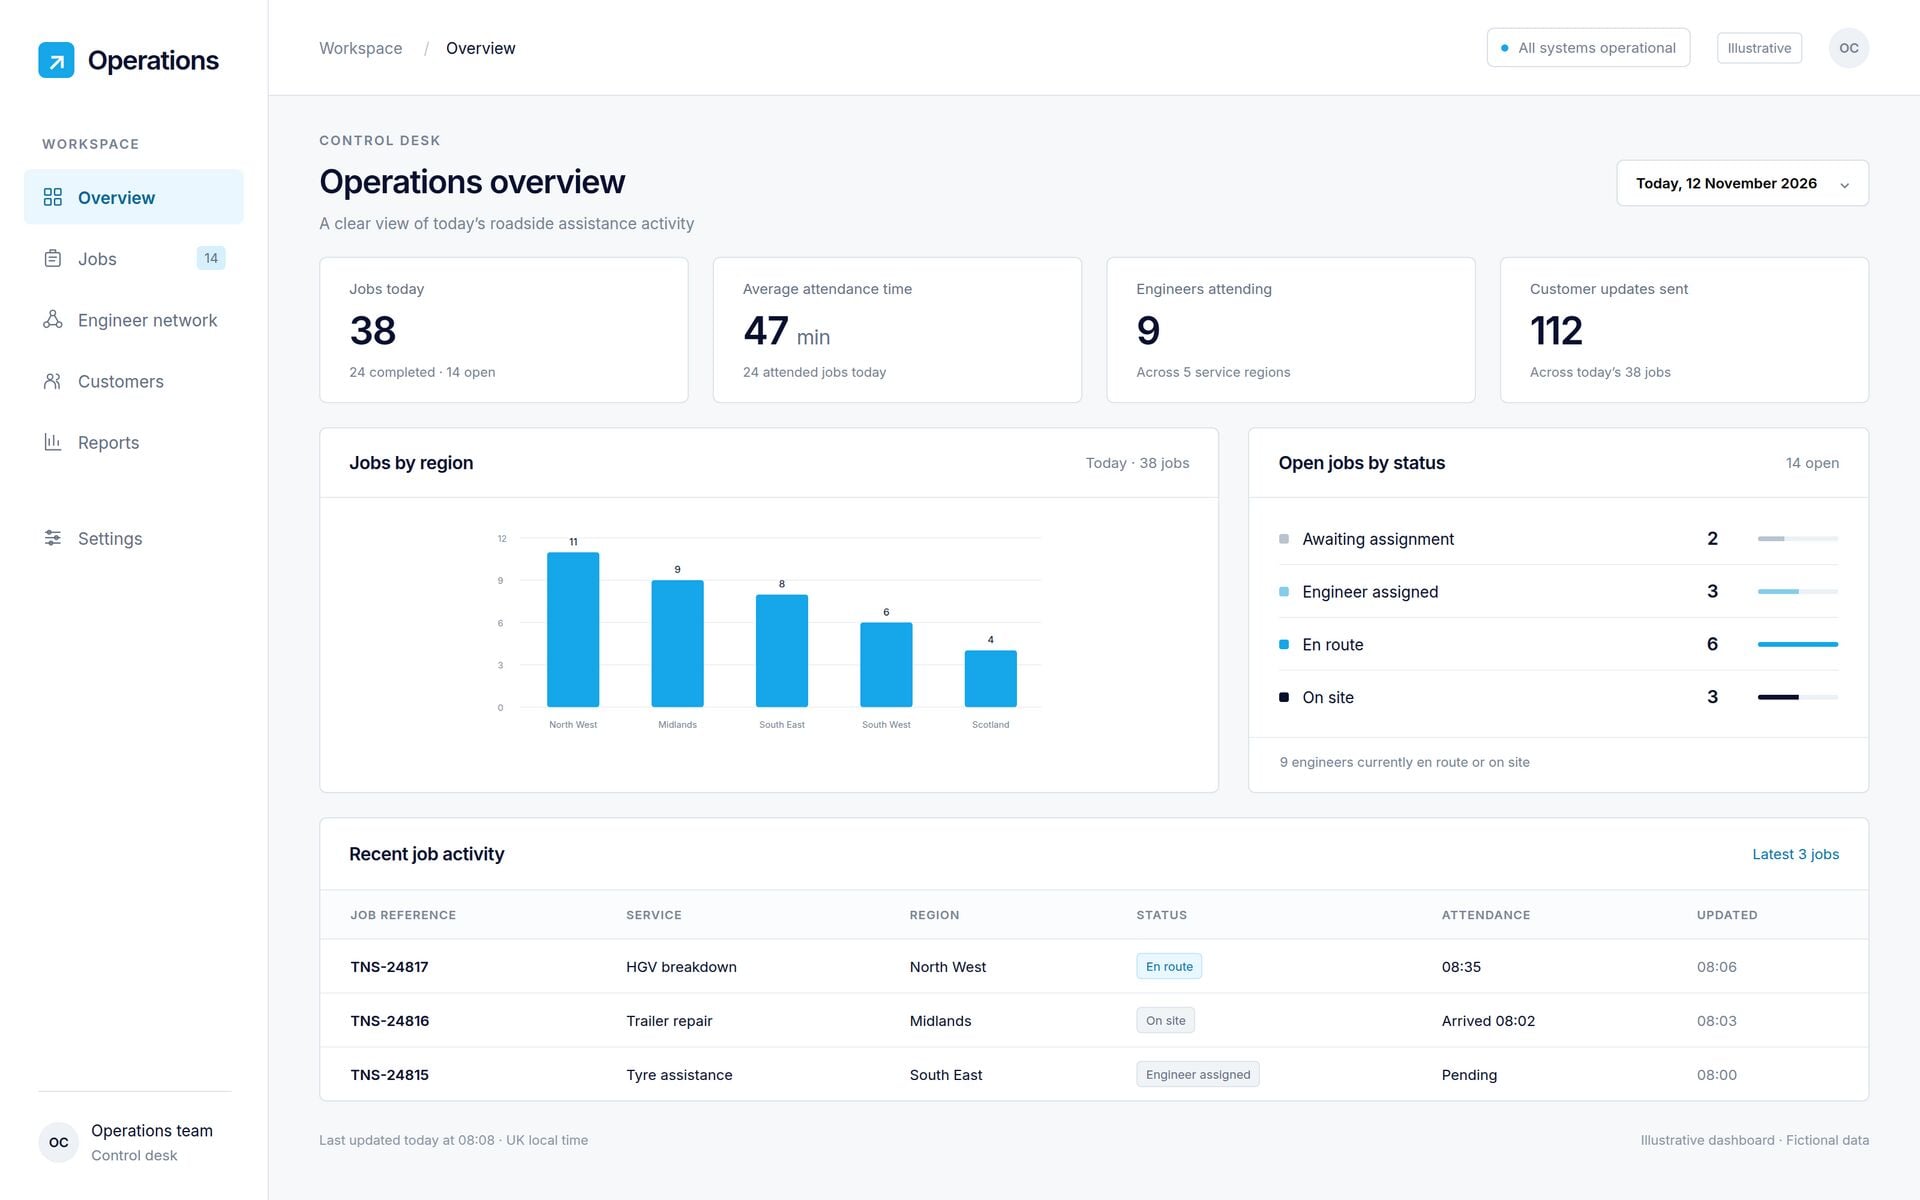
What makes a dashboard useful
A dashboard that shows everything shows nothing. We start by asking who looks at it, when, and what decision it supports. The first version is usually small and sharp, and it grows as people use it.
Data comes from where the work already happens: your job system, your telephony, your accounts and your spreadsheets. Where the source is messy, cleaning it is part of the job, so the numbers can be trusted.
- Built around the decisions people make
- Pulls from the systems you already use
- Numbers you can trace back to the source
What we build
Views for every part of the operation
Live operations views
Open jobs, what is late, who is on the way and what needs attention now, on a screen the whole team can see.
KPI and performance reports
Response, allocation and arrival times, call volumes and service levels, measured the same way every time.
Management summaries
Daily, weekly and monthly views of activity, trends and growth, with comparisons against previous periods.
Customer-ready reports
Clear, branded reports you can share with your own customers, showing the service you delivered.
Scheduled reports
The reports people need, built and emailed automatically at the time they need them.
Alerts on what matters
A message when a number moves the wrong way, such as a missed target or a job going quiet, instead of finding out later.
From our own reporting
We run our own 24/7 operation on dashboards we built. These are the kinds of views we use every day.
Call handling dashboard
Out-of-hours activity visible live, so nothing waits for the morning.
KPI reports
Allocation time and engineer arrival times, tracked job by job.
Live views by month
Top customers, top agents and top breakdown regions at a glance.
How we work
From spreadsheet to live view
Agree the questions
Who uses it, when, and what they need to decide. That sets what goes on the screen and what stays off.
Connect the data
We link your job system, telephony, accounts or spreadsheets, and clean up the data where it needs it.
Build a first version
A small, sharp dashboard or report, checked against figures you already trust.
Refine with use
We add views and alerts as people use it, and automate the reports that are still built by hand.
Related technology
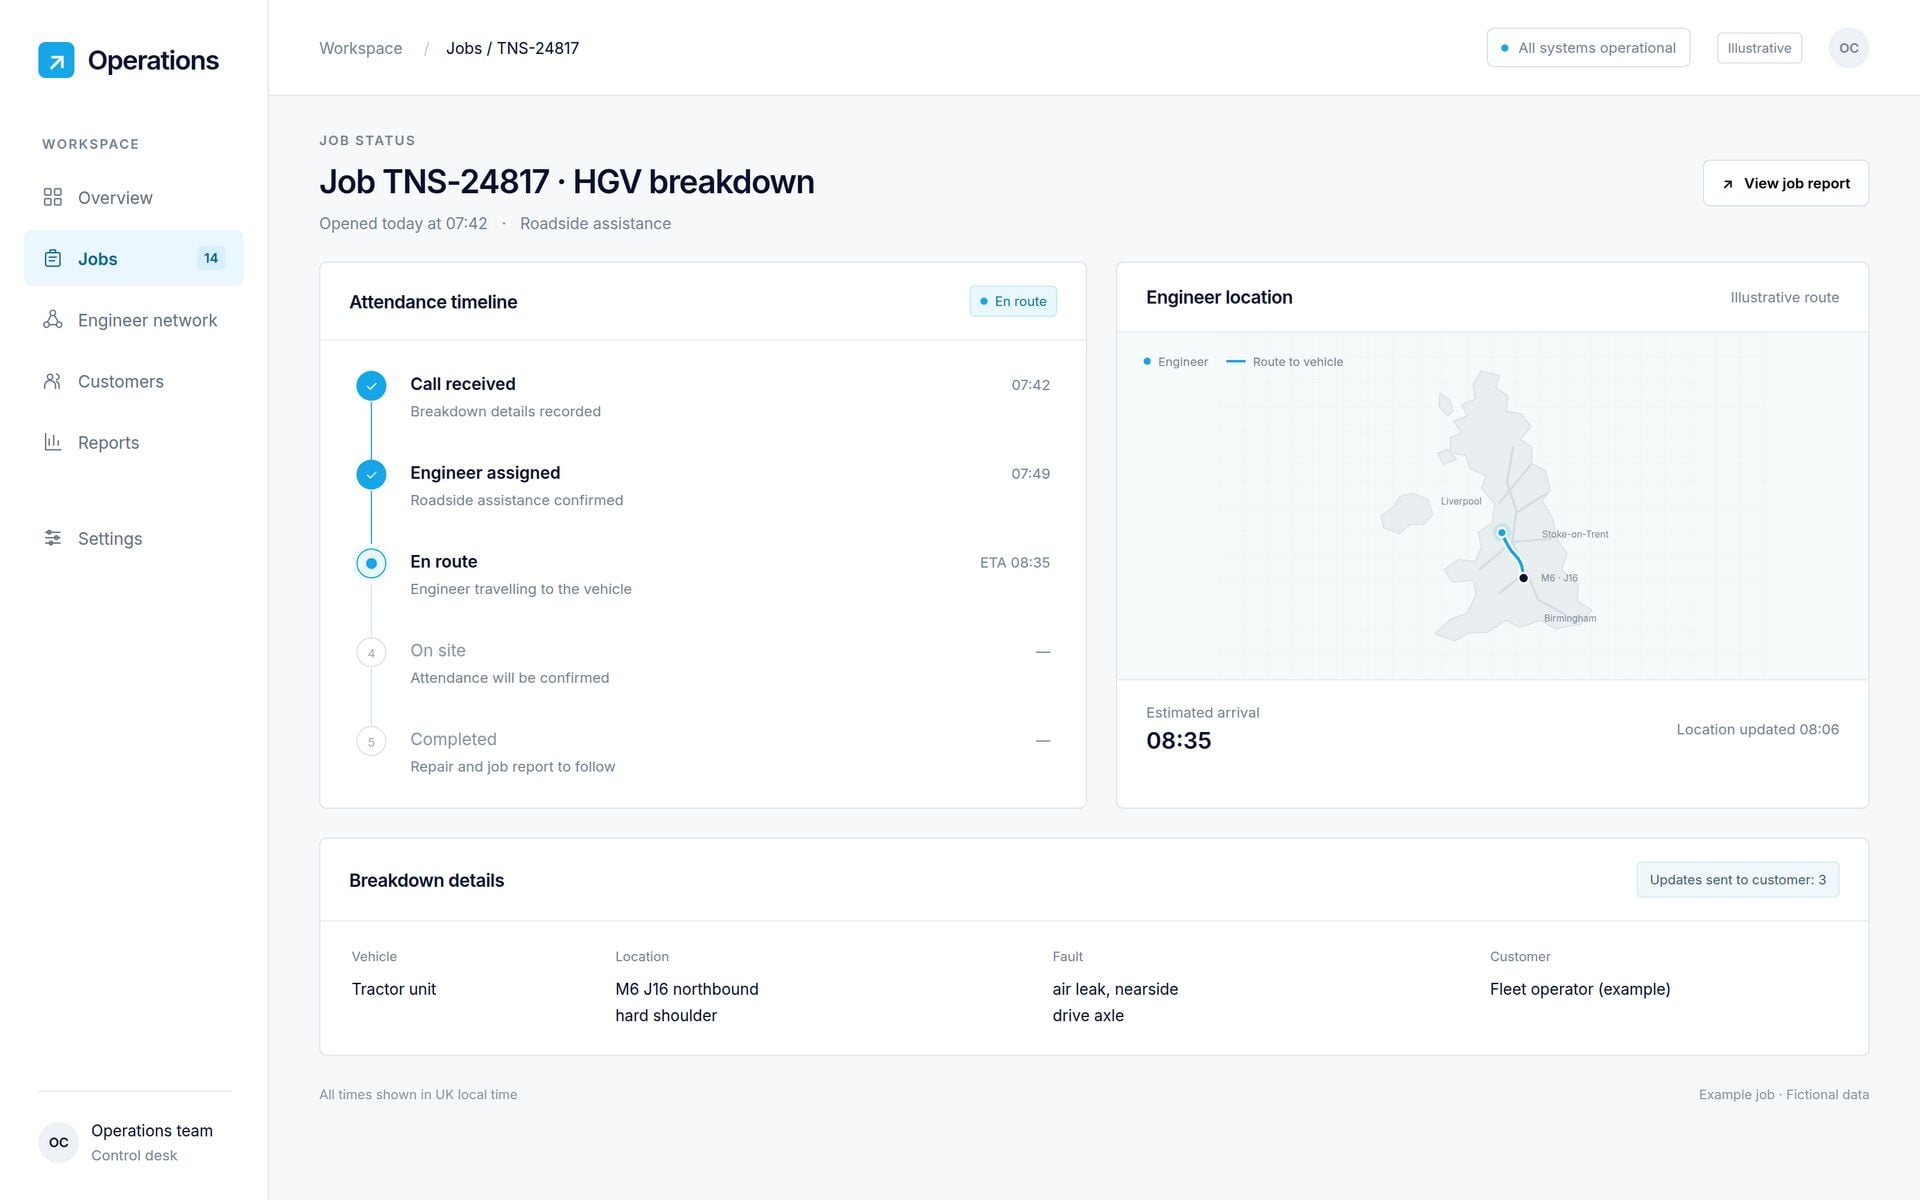
Fleet Management Technology
Job, engineer and vehicle visibility, built on how a breakdown operation really runs.
Learn more
Business Automation
Workflow automation, legacy integration and AI business solutions.
Learn moreBespoke Software Development
Software designed around one operation instead of the other way round.
Learn moreQuestions we are asked
Can you connect to our data?
Often, including older systems and spreadsheets. We need to see what you have, and we will tell you plainly what can be connected and how.
Is it real time?
It depends on the source. Some data can update live, some every few minutes and some daily. We will tell you what is realistic for each.
Who can see it?
You decide. Dashboards sit behind a login, and views can be limited by role, team or customer.
Can our customers have their own reports?
Yes. We can build customer-facing reports and views that show only their own jobs and service levels.
Discuss a Bespoke Project
Tell us the operation and the problem. We will tell you honestly whether and how we could help.